YouTube Algorithm 2026: 7 Ranking Signals Every Creator Must Know
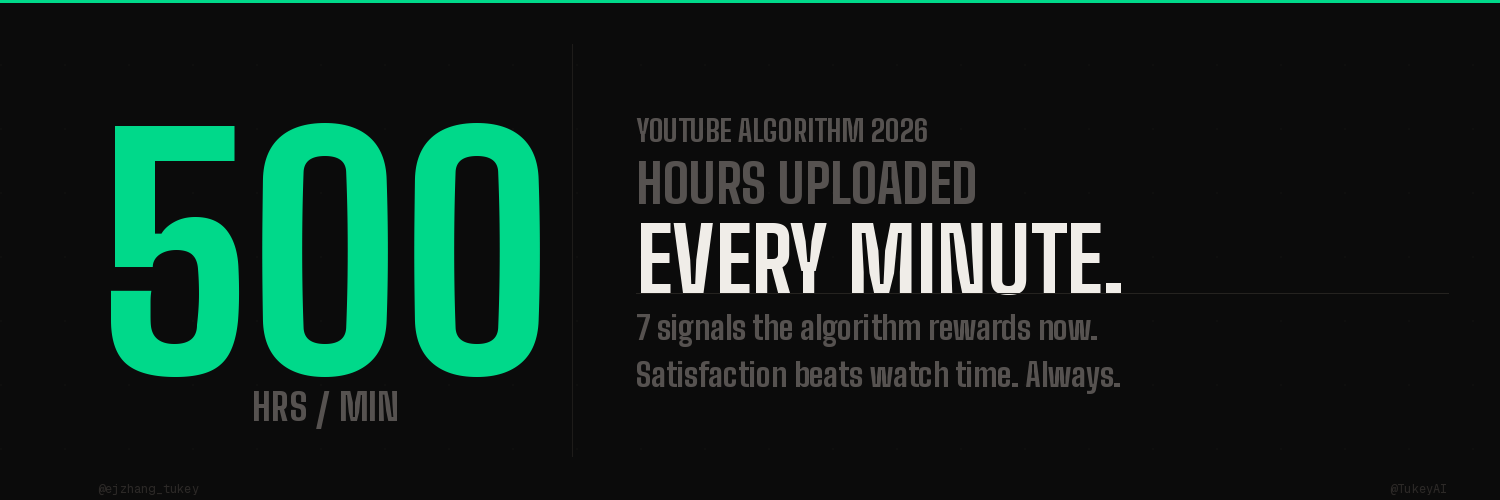
The 2026 shift from watch time to satisfaction changes everything. Here are the specific signals the algorithm now rewards, and how to structure your content around them.
500 hours of video get uploaded to YouTube every single minute. There are 65 million active creators competing for the same impressions. The platform has 2.7 billion monthly users watching 1 billion hours of content per day.
The algorithm is not trying to find the best video. It is trying to predict which video will leave a specific viewer satisfied enough to keep watching. Those are two completely different problems.
In February 2026, YouTube's recommendation team confirmed what creators had been observing for months: the engine now weights satisfaction signals above raw watch time. That single shift makes most of the optimization advice from 2023 and 2024 either obsolete or actively harmful.
This piece breaks down the 7 ranking signals that actually drive distribution in 2026. Not a general overview. The specific mechanics, the benchmarks, and what to do with each one.
The 2026 YouTube Algorithm Is Not One System
Before the signals: a foundational correction.
Most creators talk about "the YouTube algorithm" like it is a single thing. It is not. YouTube runs multiple independent recommendation systems across different surfaces: Browse (the home feed), Search, Suggested videos, the Shorts feed, Subscriptions, and Notifications. Each surface weights signals differently based on viewer intent.
Browse and Suggested are the two surfaces that drive the most views for most channels. And both of them now prioritize satisfaction signals over pure engagement volume.
Understanding this separation matters because optimizing for YouTube Search (where topical relevance is the dominant signal) requires a different approach than optimizing for Browse and Suggested (where satisfaction prediction is everything). Most channels need both. The 7 signals below apply primarily to the Browse and Suggested surfaces, which together account for the majority of non-subscriber discovery traffic.
Signal 1: Viewer Satisfaction Score (The New Primary Signal)
What it is: Post-watch surveys, likes, saves, shares, and repeat views, combined into a satisfaction prediction score that the algorithm assigns to each video.
YouTube conducts real-time surveys after video playback. These are the small "How did you like this video?" prompts that appear for a subset of viewers. The survey results calibrate how the algorithm weights everything else about a video.
A high satisfaction score amplifies a video's distribution. A low score suppresses it, even if watch time and CTR look healthy on paper.
The practical meaning: a 3-minute video with strong survey scores can now outrank a 20-minute video with higher raw watch time. YouTube confirmed this directly in February 2026. Watch time is still tracked. It is just no longer the top of the hierarchy.
What to do about it: You cannot game surveys. You can earn them. End your videos with a clear payoff that delivers on whatever the title promised. The viewers who feel satisfied are the ones who click like, share, or immediately click into another one of your videos. Build the ending of every video around the question: did I actually give them what the thumbnail said I would?
Signal 2: First-30-Second Retention (The Algorithm's Gating Checkpoint)
What it is: The percentage of viewers still watching at the 30-second mark. This is now one of the algorithm's early distribution triggers.
The data is specific: videos that hold 75% or more of viewers through the first 30 seconds get actively pushed into Suggested. Videos that fall below 60% at 30 seconds typically stall. The algorithm interprets a steep early drop as a signal that the title or thumbnail overpromised relative to what the video delivered.
Most videos lose 30 to 40% of their audience in the first 30 seconds. That means the average creator is consistently triggering the "stall" response.
Research from 2025 retention benchmarks shows that strong hooks, defined as 65% or more of viewers still watching at 30 seconds, correlate with 58% higher average view duration across the rest of the video. The hook does not just keep people for those 30 seconds. It sets the behavioral trajectory for the entire watch.
What to do about it: Your first 30 seconds have one job: prove the video is worth watching. Not introduce yourself. Not recap what you are going to cover. Deliver the first hit of value immediately. State the core insight, show the surprising result, or pose the specific question that the video resolves. Then keep building.
The 30-second retention rate for each video is visible in YouTube Studio under Audience Retention. Pull it for your last 10 videos. If the average is below 65%, your hook strategy needs a rebuild before anything else.
Signal 3: Quality CTR (Not Click-Through Rate Alone)
What it is: The relationship between your click-through rate and your early retention. In 2026, a high CTR that immediately collapses into poor early retention now triggers active demotion, not just reduced reward.
Platform-wide, a good YouTube CTR in 2026 falls between 4% and 6%. Channels with under 1,000 subscribers typically see 6 to 10%. Suggested video CTR averages around 9.5% for content with strong topical adjacency.
Those numbers mean nothing in isolation. YouTube now evaluates what can be called "quality CTR": whether the people who clicked actually stayed. A thumbnail that generates a 12% CTR but loses 70% of viewers before 30 seconds tells the algorithm that the title was misleading. The video gets demoted.
There is a second change here that most creators have not fully processed. In 2025, YouTube changed how impressions are counted. Previously, an impression was logged whenever your thumbnail appeared on screen, even briefly. Now, an impression is only counted when the thumbnail is visible for at least 1.5 consecutive seconds.
Your impression count dropped as a result. Your historical CTR and your current CTR are measuring different baselines. If your CTR looks like it declined in late 2025, the denominator changed, not necessarily your thumbnails.
What to do about it: Stop chasing CTR in isolation. The right metric is retention at 30 seconds for your high-CTR videos. If those two numbers are both healthy, the algorithm reads your thumbnail as an honest signal. If CTR is high but early retention is low, you have a promise-delivery gap that is actively hurting distribution.
Signal 4: Session Value (The 8-to-14 Minute Sweet Spot)
What it is: How much total watch time does your video generate for the platform after it ends? Not just your video. The entire viewing session your video triggers.
YouTube wants viewers to stay on the platform. A video that ends and immediately sends a viewer to a competitor, or causes them to close the app, has negative session value. A video that ends and causes the viewer to click into another YouTube video has high session value.
In 2026, data from multiple creator analytics sources shows videos in the 8 to 14 minute range are generating the highest session value scores. The reason: viewers finish them at higher rates and then immediately continue browsing. Videos over 30 minutes see higher abandonment rates even when overall retention percentages look acceptable.
Session value is one reason the Suggested algorithm disproportionately recommends mid-length content. A 10-minute video that keeps 55% of viewers and immediately leads to two more videos watched is more valuable to the platform than a 25-minute video that gets 35% completion and ends the session.
What to do about it: Design the ending of your videos as an on-ramp into your other content. End screens, verbal callouts to related videos, and clear "next step" frames all contribute. The algorithm reads what happens in the 60 seconds after your video ends. Make sure it reads well.
Signal 5: Average View Duration Ratio (Percentage, Not Minutes)
What it is: The percentage of your video's total length that viewers watch, not the absolute number of minutes.
This distinction matters enormously and most creators get it wrong. A 10-minute video with 6 minutes of average view duration (60% ratio) performs better algorithmically than a 20-minute video with 9 minutes of average view duration (45% ratio), even though the longer video generates more raw watch time per view.
The benchmark in 2026: aim for 50 to 60% average view duration ratio or higher. Tutorial and how-to content benchmarks are 45 to 55%. Videos between 15 and 30 minutes: 30 to 45% is considered healthy. The longer your video, the lower the ratio you can accept while still signaling quality.
For YouTube Shorts, the benchmark is different: 70% or higher average completion rate is what the algorithm considers engaging enough to continue serving to new audiences.
What to do about it: Find where viewers are dropping in your Audience Retention graph. YouTube Studio shows you the exact timestamp of every drop point. A sudden drop at a specific timestamp is a problem to fix (probably a section that feels tangential or slow). A gradual, consistent decline is healthy and expected. Fix the drops. Do not just add more runtime.
Signal 6: Repeat Viewer Rate (Channel Loyalty as a Distribution Signal)
What it is: The percentage of your total viewers who return to your channel within 7 days to watch another video. This is a channel-level signal, not a video-level signal.
The YouTube algorithm builds a "viewer profile" for each channel based on who consistently returns. Channels with high repeat viewer rates get preferential placement in Browse for those viewers. It is one of the key reasons two channels in the same niche with similar view counts can have very different organic reach.
High repeat viewer rate tells the algorithm your channel builds genuine loyalty. That is harder to manufacture with a single viral video than with a consistent content pattern where viewers know what to expect and come back for it.
What to do about it: Topical consistency is the primary driver. A channel that covers one tight subject matter will always build higher repeat viewer rates than a channel that shifts between unrelated topics. Every time you post off-topic, you publish a video that satisfies none of your returning audience's interest profile.
If you are checking your Analytics, look at the Returning Viewers metric under Reach. If it is below 20% of your total views, your retention ecosystem is fragile. You are building on single-video spikes rather than compound growth.
Signal 7: The 2026 Impression Quality Threshold (What Actually Counts as an Impression)
What it is: As noted in Signal 3, YouTube changed the impression definition in 2025. An impression is now only logged when your thumbnail is visible on screen for at least 1.5 consecutive seconds. Thumbnails that scroll past instantly no longer count.
This is more than a measurement change. It is a ranking signal in its own right.
The new impression threshold means that thumbnails that generate intentional pauses (where viewers stop their scroll, look at the image, and decide to click) are now valued differently than thumbnails that generate reflexive clicks from fast scrolling. The algorithm is reading scroll behavior.
What this means practically: thumbnail designs that create a moment of cognitive friction, a question, a contrast, a number that demands attention, are being rewarded differently than thumbnails that are just visually loud. The signal YouTube is reading is "did this thumbnail make someone stop?"
What to do about it: Test your thumbnails against a simple question: if someone saw this for 1.5 seconds and could not read the title, would they stop? If the answer is no, the visual alone is not earning the pause. Text overlays that pose a direct question, specific numbers in large type, and before/after contrasts are all formats that consistently generate the intentional stop behavior the new threshold rewards.
How the Top Channels Are Using These 7 Signals Together
The creators building durable growth in 2026 are not treating these signals as a checklist. They are treating them as a feedback loop.
They script specifically for the 30-second hook (Signal 2). They design thumbnails for the 1.5-second pause (Signal 7). They structure video length around the 8 to 14 minute session value window (Signal 4). They track completion ratios by video length (Signal 5). They post within a consistent topic area that builds returning viewers (Signal 6). And they end every video with a clear payoff that earns the satisfaction signal (Signal 1) and drives session continuation (Signal 4).
Most channels operate these in isolation, checking one metric at a time and wondering why the numbers are not moving.
The Fastest Path to Implementing All 7
Manual retention analysis is slow. Pulling each video's 30-second retention, completion ratio, session value data, and CTR quality separately, across a 50-video back catalog, takes hours per week. Most creators either skip it entirely or check one metric and miss the others.
This is the workflow problem Tukey AI was built to solve.
Tukey analyzes your channel's retention curve data, identifies the exact hook patterns that correlate with your highest-performing videos, and gives you a script structure built around your specific audience's behavior. Not generic advice. Your channel's data, turned into a concrete script framework for the next video.
It surfaces the signals that are actually dragging your distribution (a flat completion ratio, a consistent 30-second drop, a CTR/retention gap) and tells you specifically where the script needs to change. You go from seven separate dashboard checks to one clear output: here is what your next video needs to look like.
A note on why we built Tukey AI
I spent six months pulling retention graphs manually for every video I made. I would open the analytics, screenshot the drop points, paste them into a notes doc, try to pattern-match across videos. It took about 90 minutes per video to get a picture I could actually act on.
The insight behind Tukey is simple: retention data already contains the information you need to write better scripts. Most creators never see it because the tooling makes it too fragmented to use. Tukey closes that gap.
tukey.ai
FAQ
Does the YouTube algorithm still care about watch time in 2026? Yes, but it is no longer the primary ranking signal. YouTube confirmed in February 2026 that satisfaction signals, which include post-watch surveys, shares, repeat views, and session continuation, now sit above raw watch time in the recommendation engine's hierarchy. Watch time is still tracked and still matters. It is just no longer the ceiling on your distribution.
What is a good average view duration ratio on YouTube in 2026? For most content, aim for 50 to 60% of your video's total length. Tutorial content benchmarks at 45 to 55%. Short-form videos and Shorts should hold 70% or above. The ratio matters more than the raw minutes, because the algorithm compares your completion rate relative to your video length, not against absolute watch time totals.
How do YouTube ranking signals differ between Search and Suggested? Search ranking weights topical relevance, keyword alignment in the title and description, and CTR for that specific query. Suggested and Browse weight satisfaction signals, session value, and repeat viewer rate much more heavily. Most high-growth channels optimize for both surfaces, but the levers are different.
What does the 2026 YouTube algorithm prioritize in the first 30 seconds? Retention rate at the 30-second mark is now a distribution trigger. Videos that hold 75% or more of viewers to 30 seconds get pushed into Suggested. Videos below 60% at that mark typically stall. The algorithm interprets a steep early drop as evidence that the title and thumbnail overpromised relative to the actual content.
Can Tukey AI help with YouTube algorithm optimization? Tukey analyzes your channel's audience retention data to identify the specific patterns that are limiting your distribution. It translates the raw analytics data into a script framework for your next video, built around your actual drop points, hook performance, and completion ratios. You can start at tukey.ai.
What video length gets the most recommended placements on YouTube in 2026? Videos in the 8 to 14 minute range are generating the highest session value scores in 2026. This is because viewers finish them at higher rates and continue watching additional content after, which the algorithm rewards with more Suggested placements. This is not a universal rule. Match your video length to your content's natural completion point, then trim everything that does not add to the payoff.
The Algorithm Is Not Complicated. The Execution Is.
YouTube's recommendation system in 2026 is asking one question: will this viewer be satisfied if they watch this video? Every signal on this list is a different way the algorithm tries to predict the answer.
The creators winning in 2026 are not the ones with the best gear or the most consistent upload schedule. They are the ones who actually closed the gap between what the thumbnail promised and what the video delivered.
That is the entire game.
My name is EJ Zhang, the CEO at Tukey AI , a production workspace built in your voice. It learns your beliefs and creative fingerprint, surfaces pre-trending topics tailored to you, helps you create with originality, predicts performance before you publish, and learns from every result to make smarter recommendations over time.